Progress October 2020
Dave Dallaghan
Project & Platform Development Manager, Compass Informatics
The purpose of the ECHOES web platform is to promote climate change awareness, adaptation, risk prevention and management. Working closely with the other ECHOES Work Packages, Work Package 7 – lead by Compass Informatics – are currently developing the following on a phased basis:
- Web platform tools to promote climate change awareness, adaptation, risk prevention and management
- Climate change modelling for habitats, impacts and adaptations supports
- Land Management application
- Integration with Earth Observation Datasets and processing engines (Sentinel Satellites)
- Visualisations of species habitats, mapping and tracking
- Suite of Citizen Science tools and apps
- Hosting system platform for the projects duration
- Future development and adoption roadmap
Current developments include the below:
Earth Observation/Remote sensing:
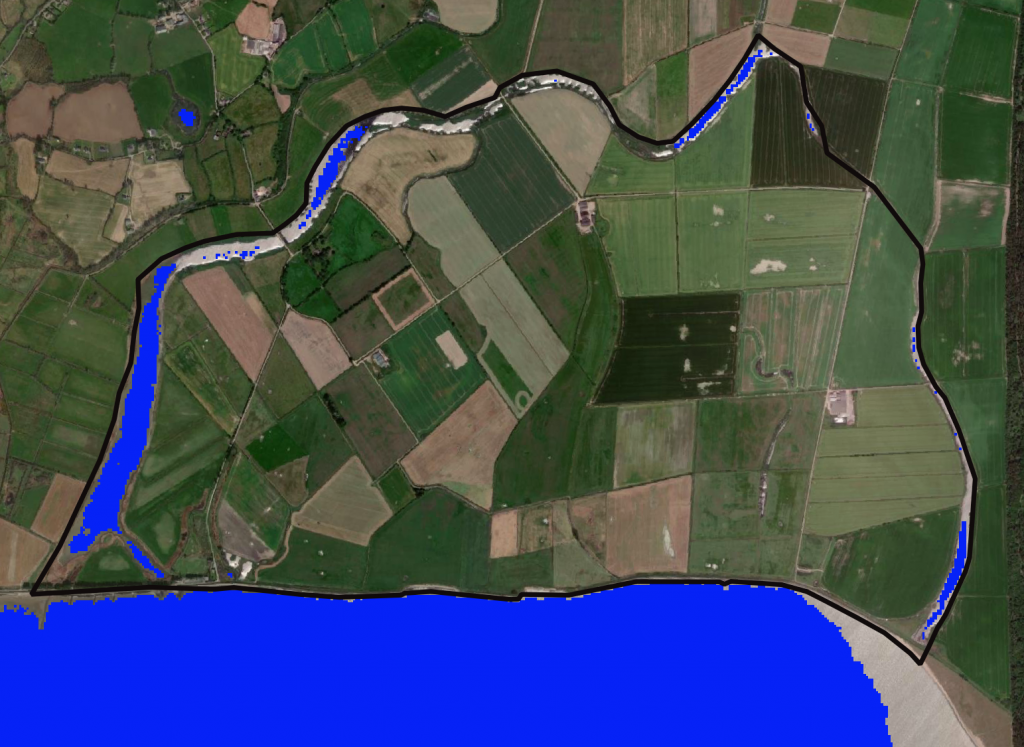
This exciting new area is developing rapidly and is becoming a vital tool for identifying and analysing climate change impacts. Images and sensing data from European Space Agency Satellites (Called Sentinel 1 and 2) is being processed within the ECHOES web platform to produce images that show the effect of climate change related impacts.
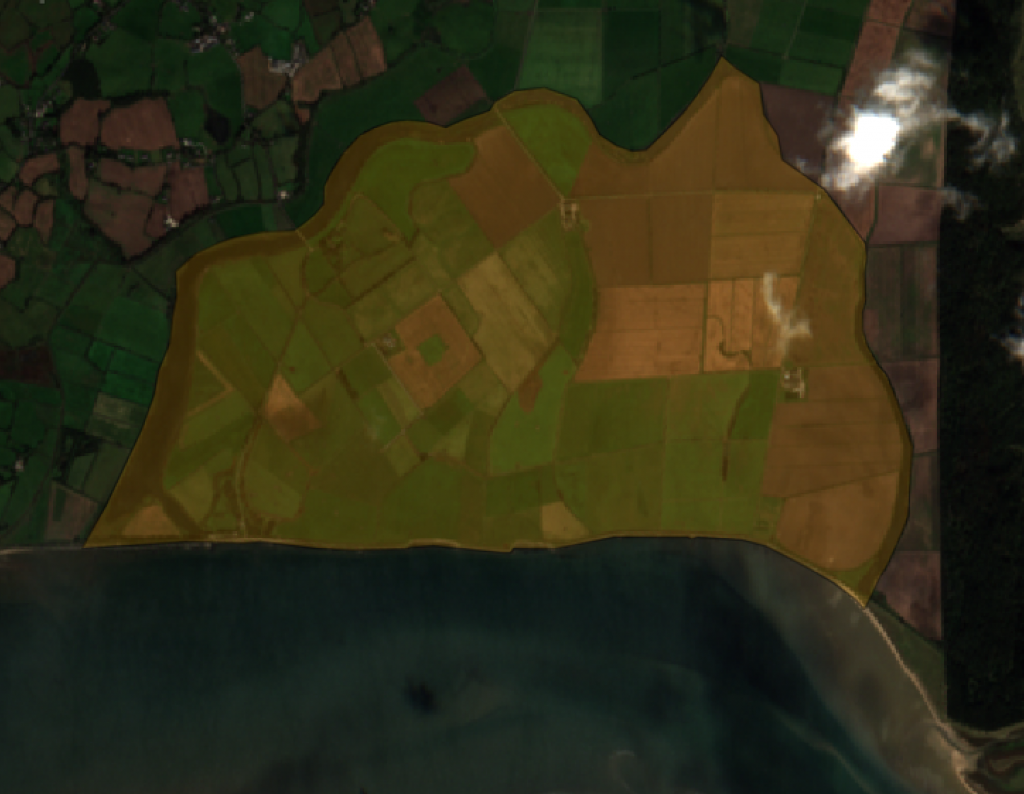
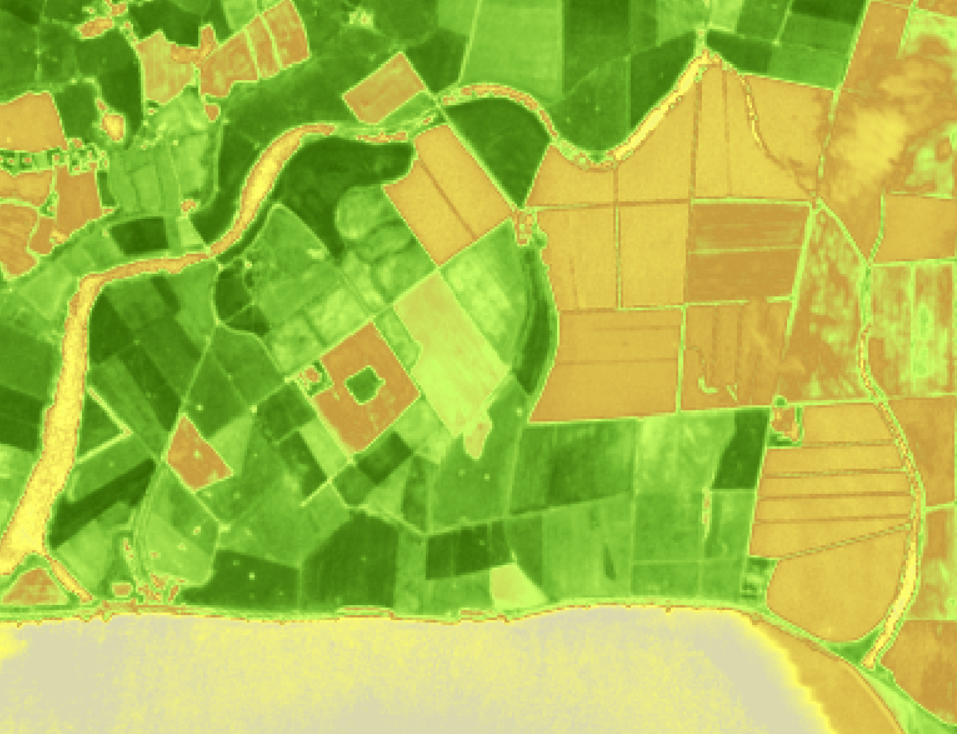
Additionally the processed image below has used infra-red light to help determine the health of vegetation. Plants reflect infra-red at different levels depending on Chlorophyll levels and this and other factors can be used to calculate how healthy the plants are, for example if they are in drought conditions.
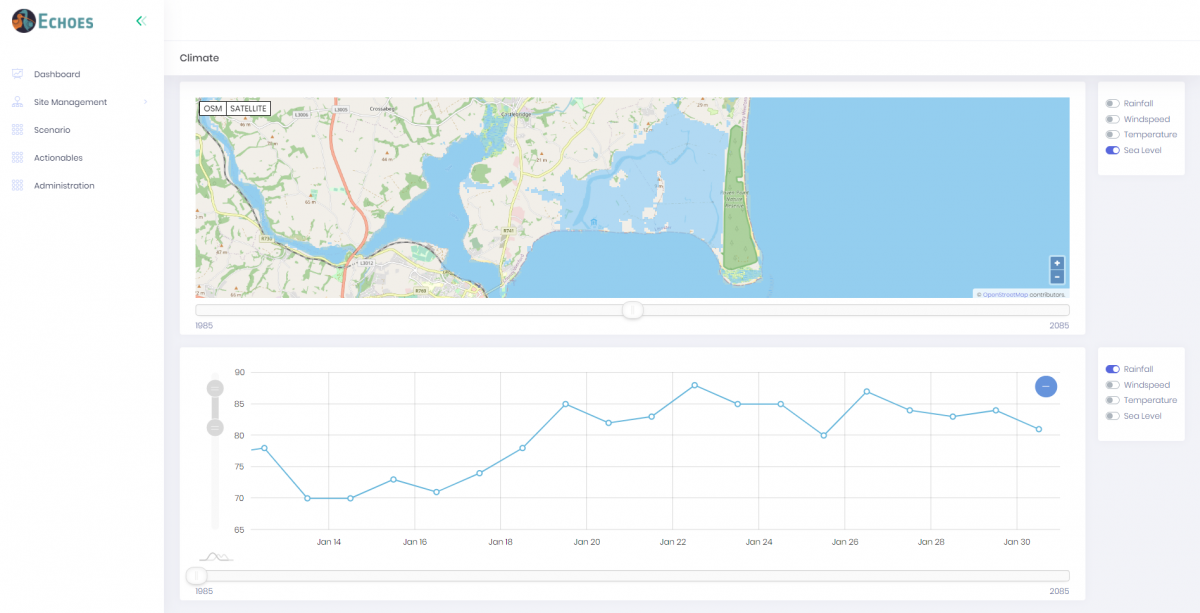
The image below shows how historical data has been merged with future predictions to show the effect of climate change over a period of a hundred years. A user can select Rainfall, Windspeed, Temperature and Sea Level and view historical records for these, as well as predictions of how they are likely to alter as the climate changes. These are shown for the users own area.

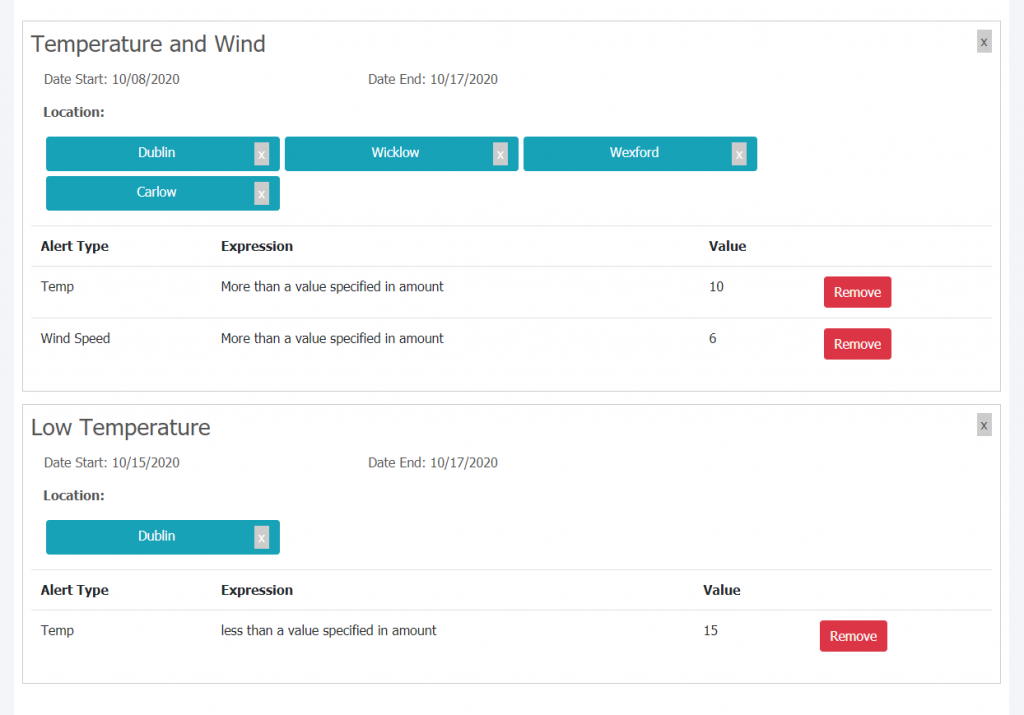
Given that extreme weather events are becoming more frequent and intense due to climate change, a Weather Warning App is being developed to allow users build alerts. This will help them plan for extreme events in their areas. It will also allow them to set their own limits and combinations of variables for warnings, for example: “Tell me when a very high wind will be combined with a very high temperature.”